Lift is the aerodynamic force that holds an aircraft up. It is produced by the wing moving through air, and it acts at right angles to the direction of the oncoming airflow. Everything about how an aircraft is flown, from takeoff speed to the stall, follows from how that force is generated and what controls its size.
There are two correct ways to describe where lift comes from, and they are two views of the same thing. There is also a popular explanation that is wrong. This guide covers all three and then turns to the equation used to put a number on lift.
A wing turns the air
A wing meets the airflow at a small angle and has a shape that guides the air smoothly around it. The air leaving the trailing edge is moving slightly downward compared with the air that arrived at the leading edge. The wing has deflected the flow.
Changing the direction of a moving mass of air takes a force. By Newton’s third law, if the wing pushes air downward, the air pushes the wing upward with an equal and opposite force. That reaction is lift. Both surfaces take part in the turning: the lower surface deflects air directly, and the air flowing over the curved upper surface follows it downward, which accounts for a large share of the total.
Pressure is how the force reaches the wing
Air can only push on a wing through pressure on its surface. As the flow curves around the wing, the air over the upper surface speeds up and its pressure falls, while the air under the wing is slowed slightly and its pressure rises. The pressure below is higher than the pressure above, and that difference, added up over the whole wing, is the lift.
The link between speed and pressure is Bernoulli’s principle: along a streamline in steady flow, faster air has lower static pressure. Flow turning and pressure difference are not competing theories. The pressure field is what turns the air, and the turned air is the evidence of the force that the pressure field applies. A complete calculation of either gives the same lift.
One common explanation should be set aside. It claims that air going over the longer, curved upper surface must speed up to rejoin the air that went underneath at the trailing edge. Nothing requires the two streams to arrive together, and measurements show the upper stream arrives first. The air over the top does move faster, but not for that reason.
The lift equation
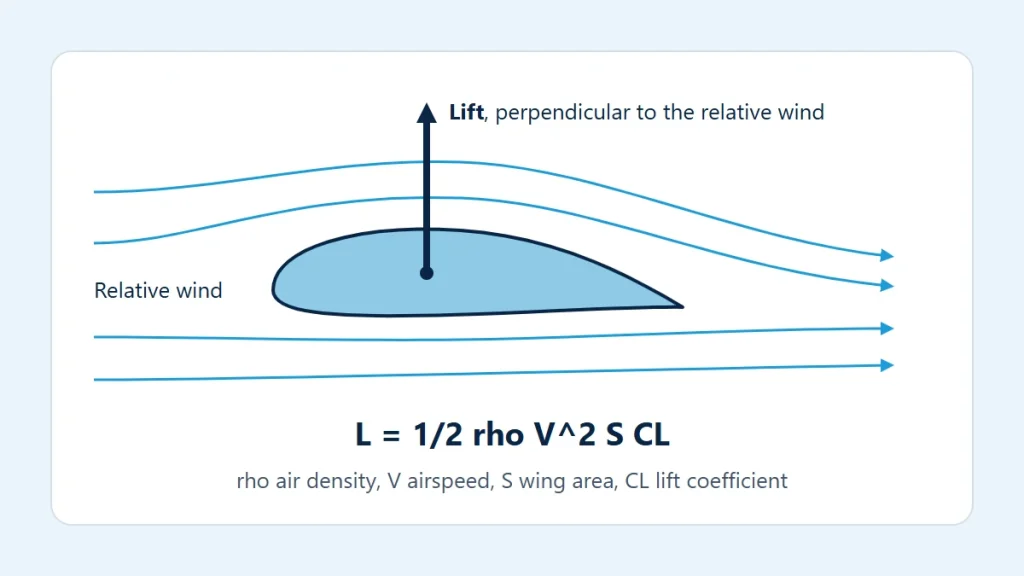
L = ½ × ρ × V² × S × CL
- L is lift, in newtons when the other terms are in SI units.
- ρ (rho) is air density in kg/m³. Denser air gives more lift at the same speed.
- V is true airspeed in m/s, the speed of the wing relative to the air.
- S is the wing reference area in m².
- CL is the lift coefficient, a number without units that captures the shape of the wing and its angle to the airflow.
The group ½ × ρ × V² is the dynamic pressure, written q. It measures how hard the moving air can press on a surface, so the equation can be read as lift = dynamic pressure × area × lift coefficient. The same structure appears in the drag equation, covered in understanding aerodynamic drag.
Angle of attack and the lift coefficient
The angle between the wing’s chord line and the relative wind is the angle of attack. The relative wind is the direction of the airflow meeting the aircraft, opposite to its flight path; it is not the horizon. In the diagram at the top of this page, lift is drawn perpendicular to the relative wind for exactly this reason.
Increasing the angle of attack turns the air more and raises CL, roughly in a straight line over the normal working range. That continues up to the critical angle of attack. Beyond it, the flow can no longer follow the upper surface and separates from it, CL drops and drag rises sharply. That is the stall. It is tied to an angle, not to a single speed, which is why the stalling speed changes with weight and load factor, as described in load factor and aircraft maneuvers. Flaps change the wing’s shape and raise the CL available at a given angle.
Trying the numbers
Take a baseline of round, illustrative values that describe no particular aircraft: sea-level standard density of 1.225 kg/m³, a true airspeed of 50 m/s, a wing area of 16 m² and a lift coefficient of 0.5. The lift force calculator gives a dynamic pressure of 1,531.3 Pa and a lift of 12,250 N (2,754 lbf). Changing one input at a time shows what each term does:
| Change from the baseline | Lift | Compared with baseline |
|---|---|---|
| None | 12,250 N | — |
| Speed doubled to 100 m/s | 49,000 N | Four times |
| CL doubled to 1.0 | 24,500 N | Twice |
| Density reduced to 0.9046 kg/m³ | 9,046 N | About 74% |
Speed is squared, so it dominates. The density in the last row is the standard-atmosphere value at 10,000 ft, which you can confirm with the standard atmosphere calculator; lift falls in direct proportion to density when nothing else changes.
Balancing lift against weight
In steady level flight, lift equals weight. Weight does not change from moment to moment, so the product ρ × V² × CL has to stay constant. This is the trade behind much of ordinary flying:
- Flying slower requires a higher CL, which means a higher angle of attack. The slowest steady speed is reached when CL is at its maximum.
- Flying in thinner air requires a higher true airspeed for the same CL. This is why takeoff and landing true airspeeds, and the runway used, increase at high density altitude, a subject taken up in air density and aircraft performance.
- Carrying more weight on the same wing requires more speed or more CL. The ratio of weight to wing area is wing loading, which the wing loading calculator works out.
What the equation hides
The lift equation is exact only in the sense that it defines CL. All the difficult aerodynamics is packed into that one coefficient. It depends on the airfoil, the wing’s planform, the angle of attack, flap and slat position, surface condition such as frost or contamination, and at higher speeds the Mach number. It cannot be guessed; it comes from wind-tunnel, flight-test or computational data for the specific aircraft.
The calculation also treats the air as uniform and the flight as steady, and ignores gusts, ground effect and the lift contributed or subtracted by the tail and fuselage. Stalling speeds, takeoff and landing performance and operating limits for an actual aircraft come from its flight manual (POH/AFM), used with current weather information and the applicable regulations.