Drag is the aerodynamic force that acts opposite to an aircraft’s motion through the air. Thrust has to balance it in steady level flight, so drag sets how much power a given speed costs, how far an aircraft glides and how quickly it slows when thrust is reduced.
Drag is not one thing. Part of it grows as the aircraft flies faster and part of it shrinks, and the way those two parts add up explains most of what a performance chart shows.
The drag equation
Total drag is usually written in the same form as the lift equation:
D = ½ × ρ × V² × S × CD
- ρ is the air density, in kg/m³.
- V is the true airspeed, in m/s.
- S is a reference area, normally the wing area, in m².
- CD is the drag coefficient, a dimensionless number that collects everything about shape, surface, angle of attack and configuration.
The group ½ × ρ × V² is the dynamic pressure, q. It is the same quantity that appears in the lift equation, which is covered in basic principles of aircraft lift. The equation does not explain drag; it is a bookkeeping device that puts all the complicated physics into one coefficient that has to be measured or estimated for the actual aircraft.
Two components that behave in opposite ways
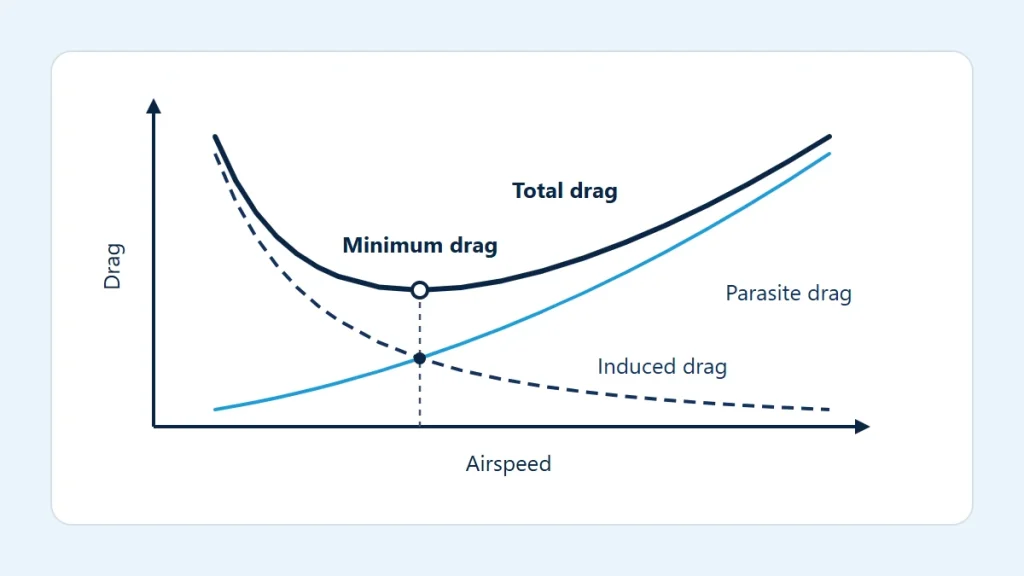
Parasite drag is the drag that has nothing to do with producing lift: skin friction over every wetted surface, pressure drag from the shape of the fuselage, landing gear and antennas, and interference where components join. Its coefficient stays roughly constant over the normal speed range, so the force follows dynamic pressure and rises with the square of airspeed.
Induced drag is the price of lift. A wing of finite span leaves trailing vortices behind it, and the downwash they create tilts the lift force slightly backward. The backward part is induced drag. In the simple textbook model its coefficient is proportional to the square of the lift coefficient:
CD = CD0 + CL² ÷ (π × e × AR)
Here CD0 is the parasite (zero-lift) coefficient, AR is the wing aspect ratio and e is an efficiency factor a little below 1. In level flight lift equals weight, so a slower aircraft needs a larger lift coefficient. Work that through and the induced drag force comes out proportional to 1 ÷ V²: it is largest at low speed and fades as speed builds.
| Speed compared with a reference | Parasite drag | Induced drag (level flight, same weight) |
|---|---|---|
| Half | One quarter | Four times |
| Same | Reference value | Reference value |
| Double | Four times | One quarter |
Why total drag has a minimum
Add a curve that rises with V² to one that falls with 1 ÷ V² and the sum is a U shape, as in the diagram at the top of this page. At low speed induced drag dominates and total drag is high. At high speed parasite drag dominates and total drag is high again. In between there is one speed where total drag is lowest, and in this simple model it is the speed at which the two components are equal.
That minimum matters because it is also where the ratio of lift to drag is greatest. An aircraft gliding at that speed covers the most distance for the height it loses. Flying slower than the minimum-drag speed puts the aircraft in the region where slowing down needs more thrust, not less, which is why that region is sometimes called the back side of the drag curve.
Weight shifts the picture. A heavier aircraft needs more lift at every speed, so its induced drag curve sits higher and the minimum moves to a higher speed.
A worked illustration
Suppose a reference area of 16 m², a drag coefficient of 0.03 and sea-level standard air at 1.225 kg/m³. These are round illustrative numbers, not data for any aircraft. Entered in the drag force calculator, they give:
| Case | Dynamic pressure | Drag |
|---|---|---|
| 100 kt, ρ = 1.225 kg/m³, CD = 0.03 | 1,621.0 Pa | 778 N (175 lbf) |
| 200 kt, same density and coefficient | 6,484.0 Pa | 3,112 N (700 lbf) |
| 100 kt, ρ = 0.9046 kg/m³ (ISA at 10,000 ft) | 1,197.0 Pa | 575 N (129 lbf) |
| 100 kt, sea level, CD = 0.06 | 1,621.0 Pa | 1,556 N (350 lbf) |
Doubling the speed with the coefficient held constant multiplies drag by four. Thinner air at the same true airspeed lowers it in direct proportion to density; the density used in the third row comes from the standard atmosphere calculator. Doubling the coefficient, as extending flaps or landing gear might, doubles the force.
What changes the drag coefficient
- Angle of attack and lift. More lift coefficient means more induced drag, so the coefficient rises at low speed, in turns and at higher weight.
- Configuration. Flaps, landing gear, speed brakes and open cowl flaps all add parasite drag.
- Surface condition. Dirt, insects, frost and ice roughen the surface and increase skin friction; ice also changes the shape.
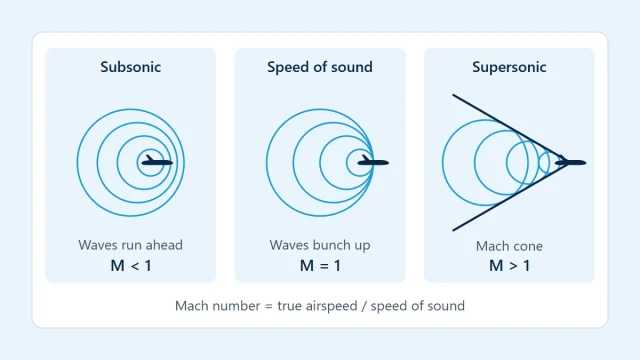
- Mach number. As local airflow approaches the speed of sound, shock waves form and wave drag appears. The simple equation with a constant coefficient stops being useful there; see understanding Mach number.
- Ground effect. Close to the surface the trailing vortices are partly blocked and induced drag falls.
Density deserves a separate mention. Drag at a given true airspeed falls as air thins, but so does the lift available and the power most engines can produce. The trade-offs are discussed in air density and aircraft performance.
Limits of the simple model
The two-component picture assumes a clean parabolic relationship between lift and drag, a constant parasite coefficient, steady level flight and speeds well below the speed of sound. Real aircraft depart from all four. Propeller slipstream, trim drag, flow separation near the stall and compressibility at high speed each bend the curve in ways one coefficient cannot capture.
The drag coefficient is also not something to guess. It comes from wind-tunnel or flight-test data for a specific aircraft in a specific configuration, and published performance already has it built in. For any real flight, glide performance, climb performance and speeds come from the aircraft flight manual (POH/AFM), used together with current official charts, weather information and applicable regulations. The equation here is for understanding why those published numbers have the shape they do.