Range is the distance an aircraft can cover on a given quantity of fuel. The simplest estimate multiplies two things: how long the fuel lasts and how fast the aircraft moves over the ground. Both halves are easy to compute, and both carry assumptions that are worth understanding before the result is trusted for anything.
This guide builds the estimate step by step, shows what wind does to it, and then lists what a constant-speed, constant-flow model leaves out.
Two steps: time, then distance
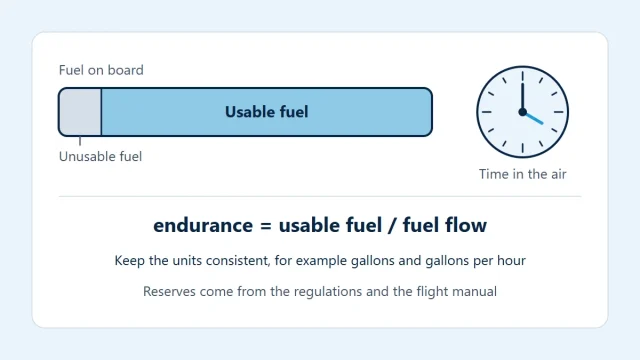
The first step is endurance, the time the fuel lasts:
endurance = fuel available ÷ fuel flow
The second step turns that time into distance:
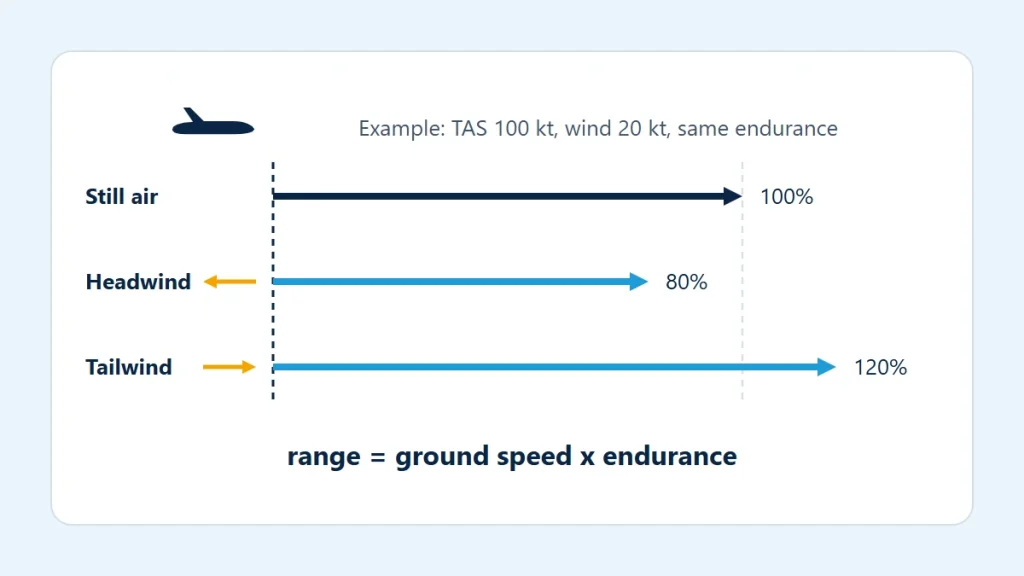
range = ground speed × endurance
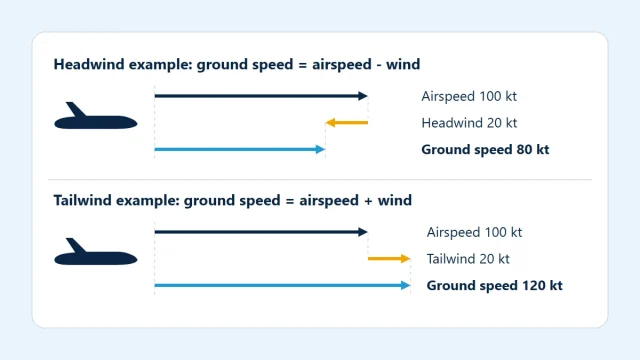
Ground speed is the aircraft’s speed over the surface. In still air it equals true airspeed (TAS), so the still-air range is TAS × endurance. With wind, the simple model adjusts TAS by the component of wind along the route:
ground speed = TAS − headwind component (or TAS + tailwind component)
Combining the steps gives range = ground speed × fuel ÷ fuel flow. The ratio of ground speed to fuel flow is the specific range, the distance flown per unit of fuel, and range is simply specific range multiplied by the fuel available. Fuel endurance mathematics explained covers the first step in more detail.
An illustration with wind
Take a set of round numbers that describe no real aircraft: 40 US gal of fuel available for cruise, a fuel flow of 8 US gal/h and a TAS of 100 kt. Endurance is 40 ÷ 8 = 5 hours. Entering these in the aircraft range estimator with three different wind components gives:
| Wind along route | Ground speed | Endurance | Estimated range | Compared with still air |
|---|---|---|---|---|
| None | 100 kt | 5 h 00 min | 500 NM | 100% |
| 20 kt headwind | 80 kt | 5 h 00 min | 400 NM | 80% |
| 20 kt tailwind | 120 kt | 5 h 00 min | 600 NM | 120% |
These are the same three cases drawn in the diagram at the top of this page. The endurance column never changes, because a steady wind does not alter how fast the engine uses fuel. Only the distance covered in those five hours changes, in direct proportion to ground speed.
Why wind matters more to slower aircraft
The effect of a wind component depends on its size relative to TAS. A 20 kt headwind takes 20 percent off the range of an aircraft cruising at 100 kt. The same wind against an aircraft cruising at 400 kt would take off 5 percent. This is why the wind forecast is such a large part of range thinking for light aircraft.
The wind component is not the wind speed. A wind blowing across the route contributes little along it, and a wind at an angle contributes only part of its speed. The headwind and tailwind calculator resolves a wind into its along-track component, and understanding headwinds and tailwinds explains the trigonometry. A strong crosswind also costs a little ground speed by itself, because the aircraft must point partly into it to hold the track; the ground speed calculator solves the full wind triangle.
Out and back is not a wash
It is tempting to assume that a headwind on the way out is paid back by the tailwind on the way home. It is not, because the aircraft spends longer in the headwind than in the tailwind.
Using the same illustrative figures, consider flying out against the 20 kt headwind and returning with it, using all five hours. A point 240 NM away takes 3 h 00 min to reach at 80 kt and 2 h 00 min to return from at 120 kt, five hours in total. In still air the same five hours would reach a point 250 NM away, at 2 h 30 min each way. The wind has reduced the distance that can be flown out and back, even though it helped on one leg as much as it hindered on the other. Any wind along the route has this effect, whichever direction it blows.
Speed, fuel flow and best range
Since range is ground speed × fuel ÷ fuel flow, the greatest range for a given fuel load comes from the highest ratio of speed to fuel flow. Flying faster raises the speed but raises the fuel flow more than proportionally at high speed, because drag grows quickly. Flying very slowly lowers the fuel flow but lowers the speed too. Between the two lies a speed that gives the most distance per unit of fuel.
That best-range speed is higher than the speed for maximum endurance, which is the speed of lowest fuel flow. A headwind shifts the best-range speed somewhat higher and a tailwind somewhat lower, because what counts is distance over the ground. The actual speeds and power settings are specific to each aircraft, weight and altitude and are published in its flight manual; the simple estimate takes whatever TAS and fuel flow you give it and does not search for an optimum.
What the simple estimate leaves out
The estimate describes a cruise at one speed and one fuel flow that continues until the fuel entered is gone. A real flight differs in several ways:
- Climb and descent. The climb uses more fuel per hour and covers less ground per hour than cruise. Start, taxi and takeoff use fuel that covers no distance.
- Changing weight. As fuel burns off the aircraft gets lighter and needs less power, so fuel flow at a fixed speed is not constant over a long flight.
- Changing wind. Wind varies with altitude, position and time. One component for the whole route is an average at best.
- Fuel that is not for cruising. The estimate burns every unit of fuel entered. It makes no allowance for reserves, alternates, holding or unusable fuel.
- Altitude and temperature. Both TAS and fuel flow at a given power setting depend on them.
For this reason the number is an aid to understanding, not a planning figure. Range for a real flight comes from the range and cruise performance data in the aircraft flight manual (POH/AFM), applied with current weather information, winds aloft and official charts. The fuel that must remain on landing is set by the applicable regulations, the operator and the flight manual, and it has to be taken out of the fuel available before any distance is estimated.
To see where the fuel flow figure itself comes from, read understanding aircraft fuel consumption.