The International Standard Atmosphere (ISA) is an agreed mathematical model of how temperature, pressure and density change with altitude. It does not describe the weather on any particular day. It is a fixed reference, so that an altimeter built in one country, a performance chart drawn in another and a calculation done on this site all mean the same thing by “5,000 ft” or “standard temperature”.
Almost every other atmosphere topic in aviation is defined against it: pressure altitude, density altitude, flight levels, airspeed calibration and the phrase “ISA plus 10” all assume this one model.
What the model fixes at sea level
ISA starts from a set of sea-level values and a few physical constants. Everything else follows from them.
| Quantity | ISA sea-level value |
|---|---|
| Temperature | 15 °C (288.15 K) |
| Pressure | 1013.25 hPa (29.92 inHg) |
| Density | 1.225 kg/m³ |
| Speed of sound | 661.5 kt (340.3 m/s) |
| Gas constant for dry air | 287.05287 J/(kg K) |
| Gravity | 9.80665 m/s² |
The air is assumed to be dry and to behave as an ideal gas.
Two layers and a boundary
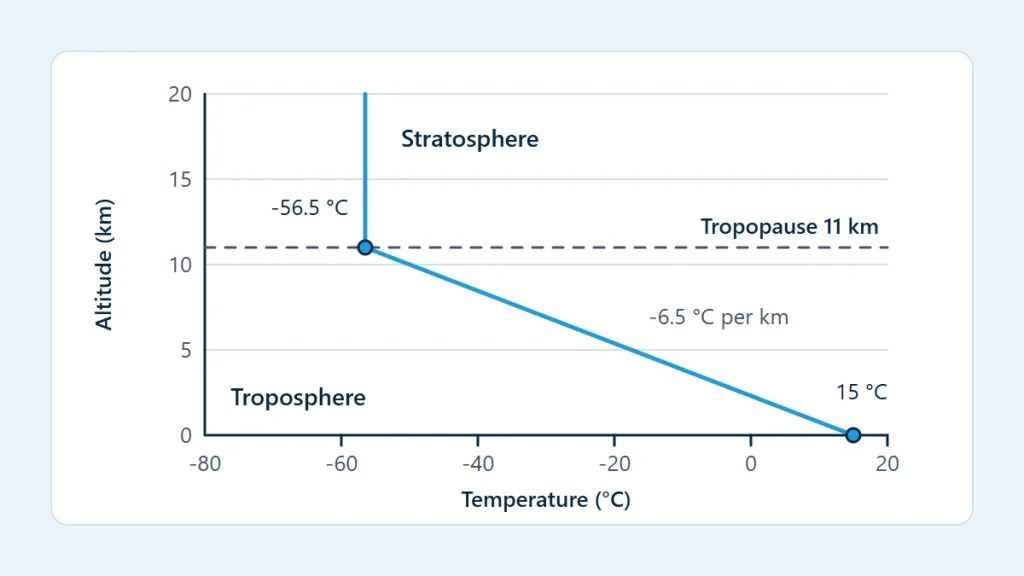
The part of the model that matters for most flying has two layers, shown in the diagram at the top of this page.
- Troposphere, sea level to 11 km (36,089 ft). Temperature falls at a constant lapse rate of 6.5 °C per kilometer, which is 1.98 °C per 1,000 ft.
- Tropopause, at 11 km. The boundary where the fall in temperature stops, at −56.5 °C (216.65 K).
- Lower stratosphere, 11 km to 20 km. Temperature stays constant at −56.5 °C. Pressure and density keep falling.
The full standard continues with further layers above 20 km. The calculators on this site model the atmosphere up to 20 km.
The equations
With h as altitude in meters, the troposphere is described by a straight line for temperature and a power law for pressure:
T = 288.15 − 0.0065 × h (kelvin)
P = 101,325 × (T ÷ 288.15)5.25588 (pascals)
In the isothermal layer above 11,000 m, temperature is fixed and pressure decays exponentially from its tropopause value:
T = 216.65 K, P = 22,632.06 × exp[−0.000157688 × (h − 11,000)]
In both layers density and the speed of sound follow from the temperature and pressure:
ρ = P ÷ (R × T) and a = √(γ × R × T), with γ = 1.4
The pressure equations are not arbitrary. They come from combining the ideal-gas law with the requirement that each layer of air supports the weight of the air above it. The exponent 5.25588 is gravity divided by the product of the gas constant and the lapse rate.
Working through 10,000 ft
To see the equations in action, take 10,000 ft, which is 3,048.0 m. These are the steps the standard atmosphere calculator shows for that input.
- T = 288.15 − 0.0065 × 3,048.0 = 268.34 K, which is −4.81 °C.
- P = 101,325 × (268.34 ÷ 288.15)5.25588 = 69,682 Pa, or 696.82 hPa (20.58 inHg).
- ρ = 69,682 ÷ (287.05287 × 268.34) = 0.9046 kg/m³.
- a = √(1.4 × 287.05287 × 268.34) = 328.4 m/s, or 638.3 kt.
The calculator also reports each value as a ratio to sea level. At 10,000 ft the temperature ratio is 0.9312, the pressure ratio 0.6877 and the density ratio 0.7385. Pressure has fallen by nearly a third, but density by only about a quarter, because the colder air partly offsets the lower pressure.
Reference values
| Altitude | Temperature | Pressure | Density | Speed of sound |
|---|---|---|---|---|
| 0 ft | 15.00 °C | 1,013.25 hPa | 1.2250 kg/m³ | 661.5 kt |
| 5,000 ft | 5.09 °C | 843.07 hPa | 1.0555 kg/m³ | 650.0 kt |
| 10,000 ft | −4.81 °C | 696.82 hPa | 0.9046 kg/m³ | 638.3 kt |
| 18,000 ft | −20.66 °C | 506.00 hPa | 0.6981 kg/m³ | 619.2 kt |
| 30,000 ft | −44.44 °C | 300.90 hPa | 0.4583 kg/m³ | 589.3 kt |
| 36,089 ft | −56.50 °C | 226.32 hPa | 0.3639 kg/m³ | 573.6 kt |
| 40,000 ft | −56.50 °C | 187.54 hPa | 0.3016 kg/m³ | 573.6 kt |
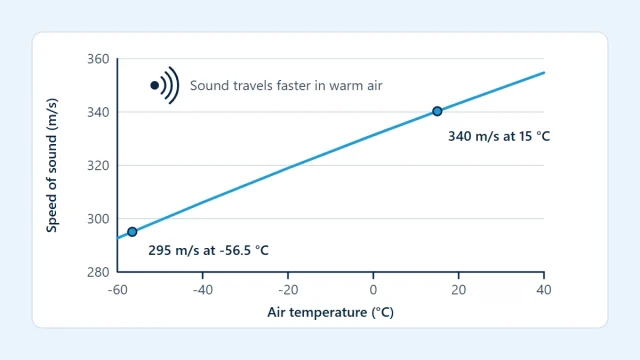
Two patterns are worth noticing. Pressure at 18,000 ft is very nearly half its sea-level value. And above the tropopause the speed of sound stops changing, because it depends on temperature alone, as Understanding the Speed of Sound explains.
ISA deviation
Real air is rarely at the standard temperature for its pressure. The difference is called ISA deviation and is written as “ISA +10” or “ISA −5”, in °C. To find it, take the standard temperature at the pressure altitude and subtract it from the measured outside air temperature. For illustration, at a pressure altitude of 5,000 ft the standard temperature is 5.1 °C, so an outside air temperature of 20 °C is ISA +14.9.
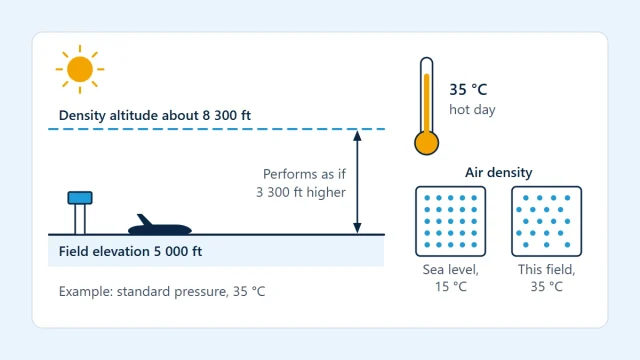
ISA deviation is the link between this model and the two altitudes built on it. Pressure altitude is the ISA altitude that matches the actual pressure; density altitude is the ISA altitude that matches the actual density, and the two differ whenever the deviation is not zero. The density altitude calculator reports the deviation alongside its result.
What the standard leaves out
ISA is a single average profile. The real atmosphere differs from it in ways that matter:
- Sea-level pressure and temperature change with the weather, the season and the time of day.
- The actual lapse rate varies, and temperature inversions, where air warms with height, are common near the ground.
- The real tropopause is not fixed at 11 km. It is generally higher over the tropics and lower over the poles, and it moves with the weather.
- The model has no water vapor, no wind and no variation from place to place.
- Its altitude is geopotential altitude, which treats gravity as constant. The difference from geometric height is small at the altitudes where aircraft fly but is not zero.
ISA values are therefore a baseline for comparison and calibration, not a forecast. Actual temperatures and pressures come from current official weather reports and forecasts, and aircraft performance for those conditions comes from the aircraft flight manual (POH/AFM), used with current charts and the applicable regulations.