Rate of climb is vertical speed: the height an aircraft gains in a given time. In most of aviation it is expressed in feet per minute (ft/min), and in metric contexts in meters per second (m/s). It is one of the most direct measures of how much performance an aircraft has in hand at any moment.
Where it comes from is often misunderstood. An aircraft does not climb because its wings produce extra lift. It climbs because its engine can deliver more power than level flight needs.
Height gained per unit of time
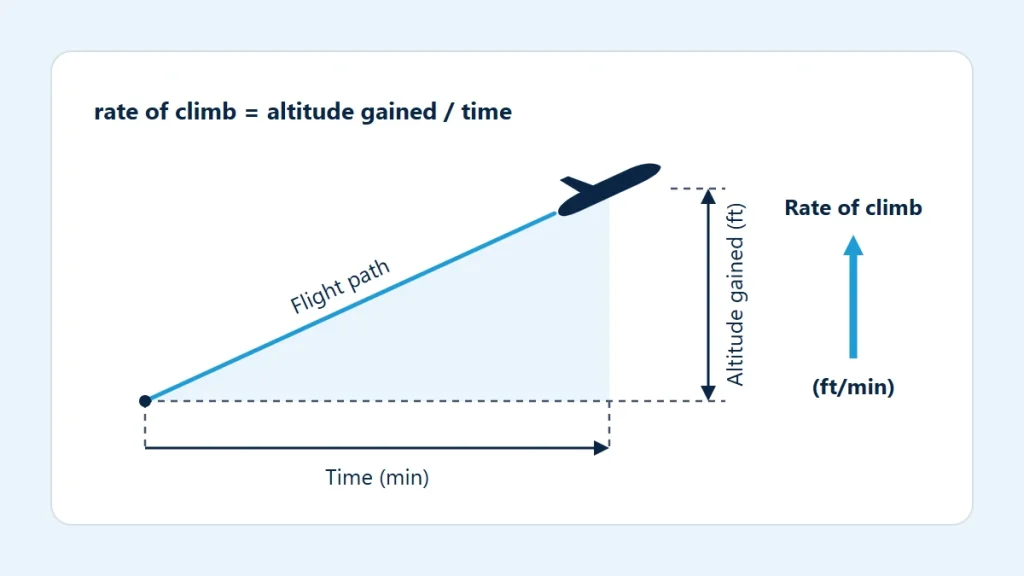
Measured from outside, rate of climb is a simple average:
rate of climb = altitude gained ÷ time
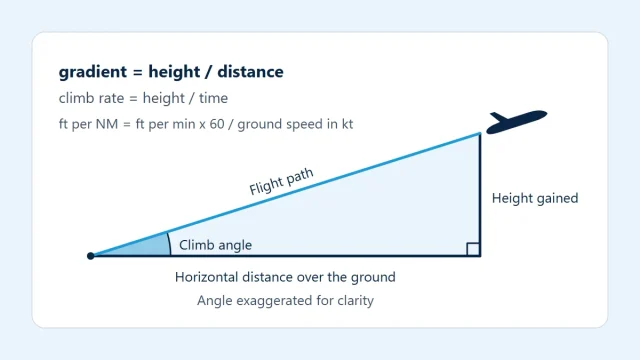
This is the slope of the flight path in the diagram at the top of this page, which plots altitude against time. A steeper line on that plot is a higher rate of climb. Note that the horizontal axis is time, not distance. A plot of altitude against distance over the ground shows something different, the climb gradient, which is compared with rate in climb gradient vs climb rate.
In the cockpit, the vertical speed indicator shows the rate by sensing how quickly static pressure is changing. An altimeter and a clock give the same information as an average over a longer period.
Excess power is what lifts the aircraft
In steady level flight, thrust equals drag and the engine supplies exactly the power needed to overcome that drag at the current speed. That is the power required. If the engine and propeller, or the jet engine, can supply more than that, the surplus is excess power, and it is available to raise the aircraft’s weight against gravity:
rate of climb = (power available − power required) ÷ weight
Power is force times speed, so the same relationship can be written with thrust (T), drag (D), weight (W) and true airspeed (V):
rate of climb = V × (T − D) ÷ W
The units must be consistent: with power in watts and weight in newtons the result is in meters per second. The formula shows three things at once. More excess power gives a faster climb. More weight gives a slower climb for the same excess power. And when power available equals power required, the rate of climb is zero, however the aircraft is pitched.
In a steady climb, lift is in fact slightly less than weight, because part of the weight is carried by thrust along the inclined flight path. Pulling the nose up without adding power trades airspeed for height for a few seconds and then leaves the aircraft slower, not climbing.
Best rate and best angle
Both power available and power required change with airspeed, so excess power is largest at one particular speed. Flying at that speed gives the most height per minute and is known as the best rate of climb speed.
A different speed gives the steepest path through the air. The climb angle depends on excess thrust, (T − D) ÷ W, not excess power, and excess thrust peaks at a lower airspeed than excess power does. That is the best angle of climb speed: it gains the most height per unit of distance but takes longer to reach a given altitude. The values of both speeds belong to the individual aircraft, weight and configuration and are published in its flight manual.
What reduces the rate
| Factor | Effect on excess power |
|---|---|
| Higher density altitude | Thinner air reduces the power of a normally aspirated engine and the thrust of a propeller or jet, while the power required at a given indicated airspeed rises. |
| Higher weight | More lift is needed, which raises drag and power required, and the remaining excess power has more weight to raise. |
| Flaps or landing gear extended | Added drag raises power required. |
| Turning | Banking raises the load factor and the drag, leaving less excess power. |
| Reduced power setting | Lowers power available directly. |
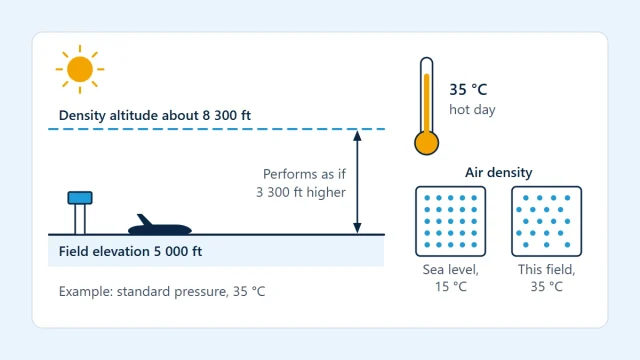
As an aircraft climbs, the air thins and excess power shrinks, so the rate of climb falls steadily with altitude. The altitude at which it reaches zero is the absolute ceiling. On a hot day at a high airfield the starting point is already well up that curve, which is why density altitude matters so much for climb. The density altitude calculator shows how elevation, pressure and temperature combine.
A steady horizontal wind is not on the list. The aircraft flies within the moving air mass, and its excess power is the same whether that air is drifting over the ground or not. Wind changes the path over the ground, not the vertical speed. Rising and sinking air are a different matter and add to or subtract from the indicated rate directly.
Numbers for illustration
Suppose an aircraft holds a steady 500 ft/min. That is 2.54 m/s, or a vertical speed of just under 5 kt, small beside a forward speed many times larger, which is why climb paths are much shallower than they feel from the cockpit. At that rate, gaining 4,000 ft takes 4,000 ÷ 500 = 8.0 minutes.
The rate of climb calculator works the link between rate and path the other way round. You enter a ground speed and a climb gradient, and it returns the rate of climb needed to fly that gradient, with the time and ground distance for a height you choose. Two cases with round, illustrative values:
- At 80 kt ground speed, a gradient of 375 ft/NM needs 500 ft/min. Gaining 4,000 ft takes 8.0 min and covers 10.7 NM over the ground.
- At 100 kt ground speed, a gradient of 300 ft/NM also needs 500 ft/min. Gaining 4,000 ft still takes 8.0 min but covers 13.3 NM.
The rate and the time are identical. Only the distance used differs, because the second aircraft is moving faster over the ground. The climb gradient calculator does the conversion from rate to gradient.
Where the arithmetic stops
The calculator tells you what rate a gradient demands. It cannot tell you whether an aircraft will achieve it. That depends on weight, configuration, engine condition, pilot technique and the density of the air on the day, and the simple formulas above treat all of those as known.
A single rate also hides the fact that climb performance decays with height, so a figure that holds just after takeoff will not hold several thousand feet higher. Average rates over a long climb are lower than the initial rate.
Expected climb performance for a real flight comes from the climb tables or charts in the aircraft flight manual (POH/AFM), entered with the actual weight, pressure altitude and temperature. Those figures are obtained under test conditions and assume the published technique. Planning a departure also needs current weather information, official charts for the terrain and any published procedure, and the applicable regulations. For background on the air itself, see air density and aircraft performance.