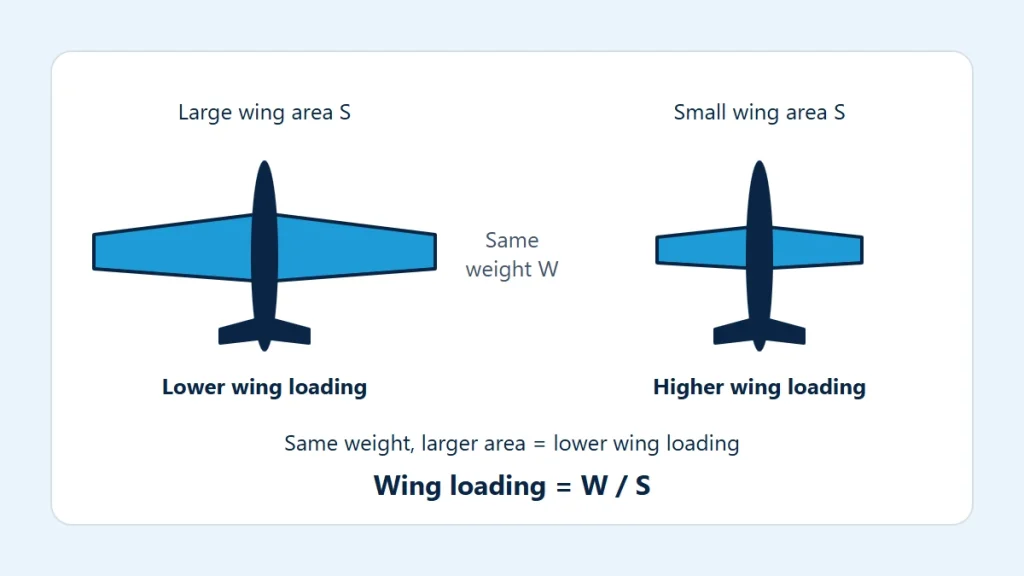
Wing loading is the weight of an aircraft divided by the area of its wing. It says how hard each square meter of wing has to work, and that one ratio influences stall speed, takeoff and landing speeds, turning ability and how the aircraft rides through rough air.
Definition and units
Wing loading = W ÷ S
W is the aircraft weight and S is the wing reference area. Three unit systems are in common use:
- kg/m²: mass per unit area, the usual metric form.
- lb/ft²: the usual form in US handbooks.
- N/m²: weight as a true force per unit area, which is a pressure and can be compared directly with dynamic pressure.
The wing loading calculator takes aircraft mass in kilograms or pounds and wing area in square meters or square feet, and returns all three forms. The force version uses standard gravity, 9.80665 m/s².
Wing area here means the reference area the designer quotes, which normally includes the part of the wing that passes through the fuselage. It is a fixed number for a given aircraft. Weight is not fixed, so wing loading is not either.
Same weight, two wings
For illustration, take a mass of 1,000 kg and put it on two different wings, as in the diagram at the top of this page. The figures are round numbers chosen for easy comparison and do not describe any aircraft.
| Mass | Wing area | Wing loading | In lb/ft² | As a pressure |
|---|---|---|---|---|
| 1,000 kg | 16 m² | 62.5 kg/m² | 12.80 | 613 N/m² |
| 1,000 kg | 10 m² | 100.0 kg/m² | 20.48 | 981 N/m² |
| 900 kg | 16 m² | 56.3 kg/m² | 11.52 | 552 N/m² |
The smaller wing carries 1.6 times as much weight on each square meter. The third row shows the first aircraft after 100 kg of fuel has been used: the wing has not changed, but its loading has dropped by a tenth.
The link to lift and speed
In steady level flight lift equals weight. Write lift as dynamic pressure times wing area times lift coefficient, divide both sides by the area, and wing loading appears on its own:
W ÷ S = ½ × ρ × V² × CL
The left side is the wing loading as a pressure. The right side is what the air can supply. A wing with a higher loading must make up the difference with more speed, more lift coefficient, or both.
The lift force calculator shows this with the two wings above. At 100 kt in sea-level standard air the dynamic pressure is 1,621.0 Pa. The 16 m² wing supports the 1,000 kg aircraft with a lift coefficient of about 0.378 (the calculator returns 9,804 N of lift). The 10 m² wing needs about 0.605 at the same speed (9,807 N). The ratio between those coefficients is the ratio between the wing loadings.
Every wing has a maximum lift coefficient, reached just before the stall. Put that maximum into the equation and solve for speed:
Vstall = √( 2 × (W ÷ S) ÷ (ρ × CLmax) )
Stall speed rises with the square root of wing loading. Four times the loading doubles the stall speed for the same maximum lift coefficient. This is the main reason designers of fast aircraft add flaps and slats: a small, highly loaded wing is efficient in cruise, and high-lift devices raise CLmax to bring approach speeds back down. The lift side of this is explained in basic principles of aircraft lift.
What high and low wing loading feel like
| Characteristic | Lower wing loading | Higher wing loading |
|---|---|---|
| Stall, takeoff and landing speeds | Lower | Higher |
| Runway needed, other things equal | Shorter | Longer |
| Tightest turn available before the stall | Smaller radius | Larger radius |
| Response to gusts | Stronger; a bumpier ride | Weaker; a smoother ride |
| Wing size and drag at high cruise speed | More wing than cruise needs | Less surplus wing area |
The gust row is worth explaining. A vertical gust changes the wing’s angle of attack and so its lift. A lightly loaded wing produces a large lift change compared with the aircraft’s weight, so the aircraft is pushed around more. A heavily loaded wing produces a change that is small against its weight.
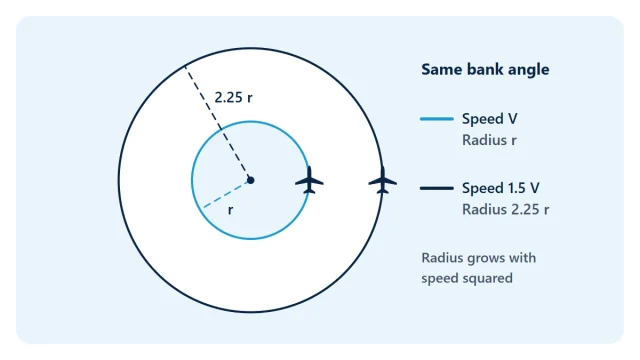
The turning row follows from the stall. A turn needs extra lift, which raises the stall speed; an aircraft with low wing loading has more margin to give away. The geometry is in understanding aircraft turn radius, and the stall effect in load factor and aircraft maneuvers.
Wing loading during a flight
Because weight changes, wing loading is a moving number:
- It is highest at takeoff with full fuel and payload.
- It falls steadily as fuel burns, which is why stall and approach speeds in a flight manual are tabulated against weight.
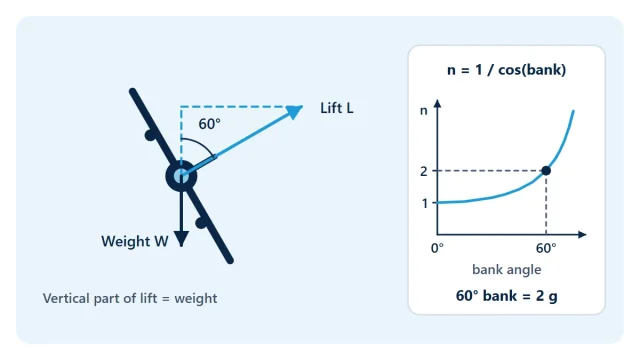
- In a turn or pull-up the wing must produce more lift than the weight, so the effective loading rises with load factor even though the mass is unchanged.
When using the calculator, enter the mass for the moment you care about. The load factor calculator gives the multiplier for a level turn at a chosen bank angle.
What the ratio does not tell you
Wing loading is one number about a wing that has many properties. Two aircraft with the same loading can have very different stall speeds because their maximum lift coefficients differ with airfoil, flaps, slats and surface condition. The ratio says nothing about aspect ratio, which governs induced drag, or about engine power, which governs climb. Air density matters as well: the same wing loading needs a higher true airspeed in thin air.
Wing loading is therefore a way to compare designs and to understand trends, not a way to work out an operating speed. Stall speeds, approach speeds, runway distances and weight limits for a real aircraft come from its flight manual (POH/AFM) at the actual weight and configuration, and real flights also need current official charts, weather information and the applicable regulations.