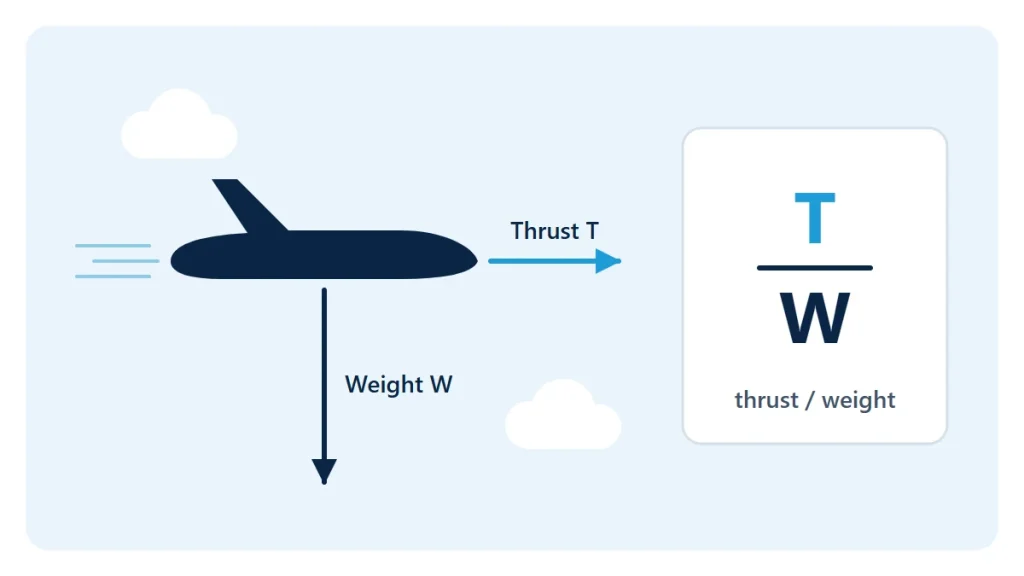
The thrust-to-weight ratio compares the force pushing an aircraft forward with the force of gravity pulling it down. It is a quick measure of how much acceleration and climb an aircraft has available, and it is one of the first numbers quoted when two designs are compared.
It is also one of the easiest numbers to misread, because neither thrust nor weight stays constant. A ratio only describes one moment of one flight.
A ratio of two forces
T/W = T ÷ (m × g)
- T is the total thrust from all engines, a force.
- m is the aircraft mass.
- g is standard gravity, 9.80665 m/s², so m × g is the weight as a force.
Both the top and the bottom are forces in the same unit, so the units cancel and the result is a pure number. This is where mistakes creep in. Thrust in newtons cannot be divided by mass in kilograms; the mass has to be turned into a weight first. In US customary units the step is hidden, because an object with a mass of one pound weighs one pound-force under standard gravity, so thrust in lbf divided by mass in lb gives the ratio directly.
The thrust-to-weight ratio calculator accepts thrust in N, kN, lbf or kgf and mass in kg or lb, converts both to newtons and divides.
One aircraft, four different ratios
Suppose an aircraft with a mass of 6,000 kg and engines producing 20 kN of thrust in total. These are illustrative round numbers, not figures for any real type. Its weight is 58,840 N, so the ratio is 0.340. Now change one thing at a time:
| Situation | Thrust | Mass | T/W |
|---|---|---|---|
| Starting point | 20 kN | 6,000 kg | 0.340 |
| After 1,000 kg of fuel has burned | 20 kN | 5,000 kg | 0.408 |
| Thrust reduced to 15 kN, as in thinner or hotter air | 15 kN | 6,000 kg | 0.255 |
| Thrust of 70 kN on the same mass | 70 kN | 6,000 kg | 1.190 |
The same airframe spans 0.255 to 0.408 without any change of hardware. The last row is included to show what a ratio above 1 means: thrust exceeds weight, so the aircraft could in principle accelerate straight up. Most aircraft are far below 1 and fly perfectly well, because the wing, not the engine, supports the weight.
The imperial version works the same way. A thrust of 4,500 lbf on a mass of 13,000 lb gives 0.346.
Why the ratio moves during a flight
Thrust is not a fixed property of an engine. A published thrust figure is normally a static value: engine at full power, aircraft stationary, sea level, standard temperature. Away from that point it changes:
- Jet thrust falls as air density falls, so it drops with altitude and on hot days. The reasons are in air density and aircraft performance.
- Propeller thrust falls sharply as airspeed rises, because a propeller turns a roughly fixed power into thrust and power equals thrust times speed.
- Any power setting below maximum reduces it by choice.
Weight falls as fuel is burned and is different on every flight depending on payload. An aircraft at the end of a long flight can have a noticeably higher ratio than it had at takeoff, as the second row of the table shows.
What the ratio does and does not predict
At the very start of a takeoff roll, drag is close to zero and the wheels carry the weight. Ignoring rolling friction, the forward acceleration is approximately T/W times g. A higher ratio means a faster build-up of speed.
In a steady climb the picture is different, because drag is no longer small. The climb angle depends on the thrust left over after drag has been paid for:
sin(climb angle) = (T − D) ÷ W
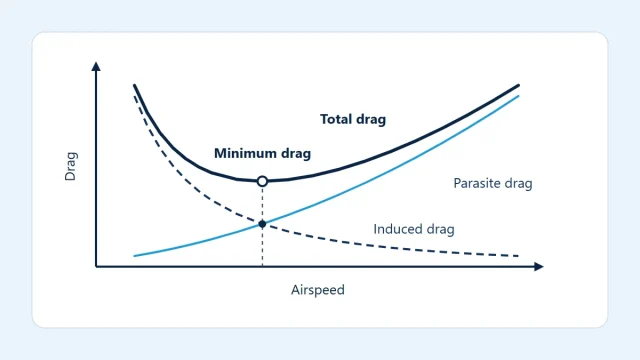
D is the drag at the climb speed. Dividing through shows that the climb angle depends on T/W minus D/W, so two aircraft with the same thrust-to-weight ratio climb differently if one has more drag. Where that drag comes from is covered in understanding aerodynamic drag, and you can explore the force itself with the drag force calculator. How the resulting climb is measured is the subject of understanding rate of climb.
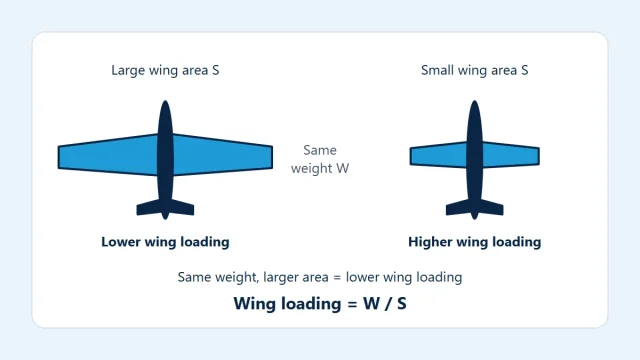
Thrust-to-weight is usually read alongside wing loading. The first describes how much push is available for each unit of weight, the second how much wing. An aircraft with plenty of thrust but a heavily loaded wing still needs a high speed before it can fly; see wing loading explained or try the wing loading calculator.
Reading published ratios with care
When a single thrust-to-weight figure is quoted for an aircraft, three questions decide what it means:
- Which thrust? Static sea-level thrust, thrust at some speed and altitude, or thrust with an afterburner are very different numbers.
- Which weight? Maximum takeoff weight gives the lowest ratio; an empty or lightly fueled weight gives a much higher one.
- Is it a thrust figure at all? Piston and turboprop engines are rated by power, not thrust. For those aircraft the usual comparison is power loading, weight divided by power, and a thrust-to-weight ratio has to be estimated at a stated airspeed.
Two ratios are only comparable when the answers to all three match.
Limits of this calculation
The calculator divides the thrust you enter by the weight of the mass you enter. It does not know how thrust varies with speed, altitude or temperature, does not include drag, rolling friction or runway slope, and uses standard gravity. Its result is exactly as good as the thrust figure put into it, and for most aircraft the thrust actually available at a given moment is not a number the pilot has.
That is why a thrust-to-weight ratio cannot stand in for performance data. Takeoff distance, climb performance and weight limits for a real aircraft come from the aircraft flight manual (POH/AFM) for the actual weight, altitude, temperature and configuration, and real operations also need current official charts, weather information and the applicable regulations. The ratio is a way to understand why those published figures get worse when an aircraft is heavy or the air is thin.